
Humanity Pandemic.com
Humanity Pandemic.com
Our last tree planting was on 5/20/2026 In Memory of: James Hannan
What if one person living on your street takes a small action to help our planet each day. How many streets are on this planet? What if this person was you? What if you told your neighbor about your small action? These small actions add up over time. Thats what it is going to take. Healing Over Time. Cast your planet healing spell today!
Here you will find a list of things you can do right now to help the planet recover from its sickness.
 Easy Solutions
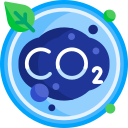
 Current Global CO2:
422.36 ppm  -2.21
-2.21
(May 2023 424.57 ppm) per CO2.earth
 Global Monthly Mean CH4:
1915.25 ppb -6.49
(May 2023 1921.74 ppb) per noaa.gov
 Global Monthly Mean N2O:
336.66 ppb  +0.21
+0.21
(May 336.45 ppb) per noaa.gov
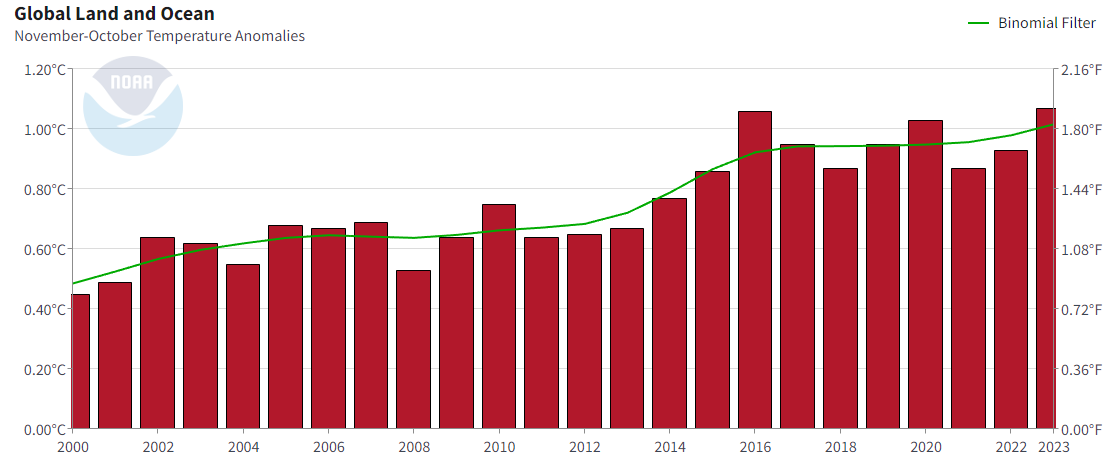
 Global Temp. Anomaly 12-Month:
1.34°C|2.41°F +0.38/0.81
(May 2023 0.89°C|1.6°F) per ncei.noaa.gov
 About Nitrous Oxide
 About Methane
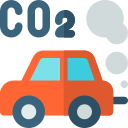
 About CO2
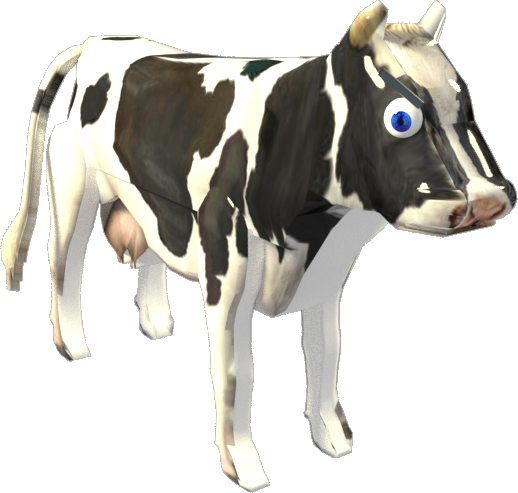 Industrial Agriculture
 While browsing this site, text that is underlined are hyper links. Click them to learn something new today!
Data updated on 11/21/2023
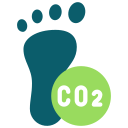 Reduce your Carbon Footprint.
 Recycle your Plastic, Cans, Cardboard and Paper.
 Support Environmentally Friendly Companies.
 Plant a Tree to Reduce Global CO2 Levels.
 Consider Switching to a Plant-Based Diet.
 Conserve Water Daily.
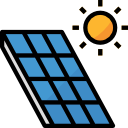 Conserve and Use Less Energy, look into Solar Power.
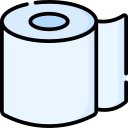 Buy Environmentally friendly products for your home. Example: bamboo toilet paper.
Living on this planet is a Gift
 CO2 (Carbon Dioxide) 60 YEAR TREND DATA
 read more
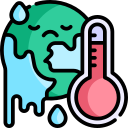
The Earth Is In a Humanity Pandemic™, was created to bring awareness to the tennants of this wonderful place.
We are in the process of sharing the information we have learned to the people we meet. We hope that, with this awareness, they make minor changes in their lives to help heal our planet.
Here we share ideas on how to help this world become a happier and healthier place. We care about all life here. The birds, the bees, the butterflies, the trees, the flowers, the oceans, the lakes and streams, the ice, the air, the clouds.


 Global CO2
Current Trend Data of the global CO2 levels (in ppm) over the last 60 years. A picture is worth 1,000 words.
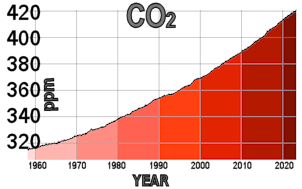
I pulled this data from climate.nasa.gov
 Global CH4
Current Trend Data of the global CH4 levels (in ppb) over the last 40 years. A picture is worth 1,000 words.
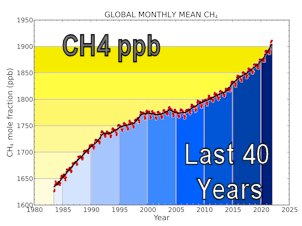
I pulled this data from gml.noaa.gov
/ccgg/trends_ch4
 Global N2O
Current Trend Data of the global N2O levels (in ppb) over the last 50 years. A picture is worth 1,000 words.
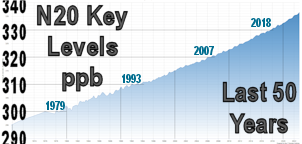
I pulled this data from www.n2olevels.org